
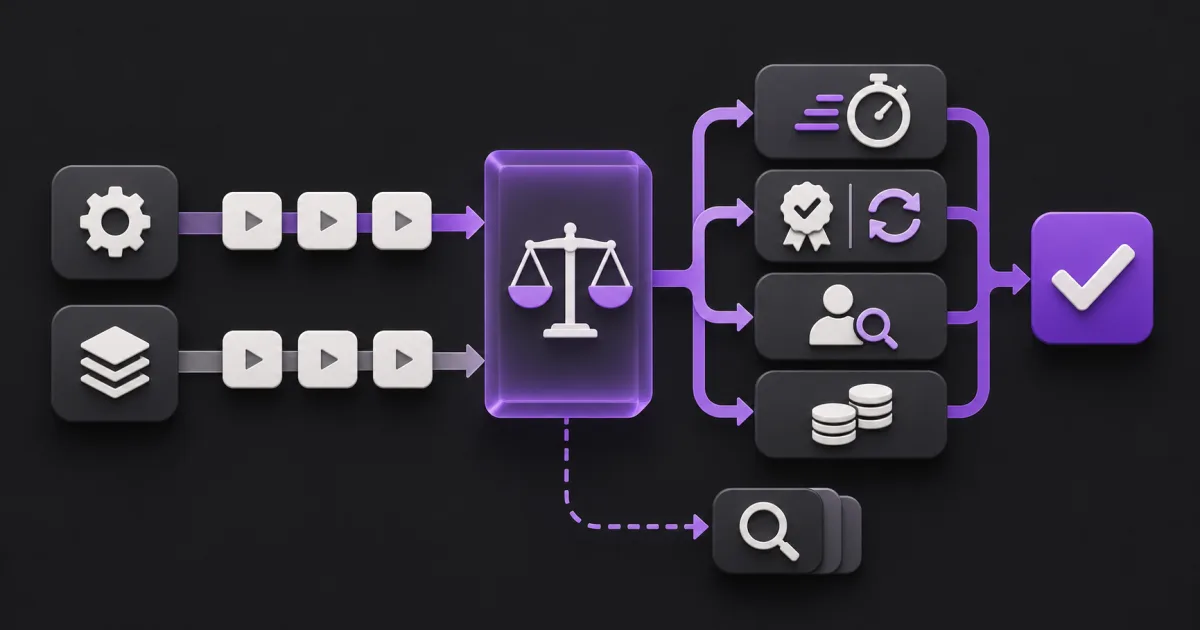
What does AI automation success actually mean?
AI automation succeeded when an owned business outcome improved against a credible comparison and the workflow stayed within its quality, risk, reliability, human-review, and cost limits. A faster model response is not enough. Neither are more runs, prompts, generated messages, or active users.
Zyphh's AI automation options should end in an operating decision: scale, tune, pause, replace, or retire the workflow. To make that decision, measure the full path from trigger to confirmed completion. Keep the outcome separate from the system signals that help explain it.
For example, a support-triage workflow may have a business outcome of eligible tickets reaching the right owned queue sooner. Classification accuracy, latency, token use, and run count help diagnose the system. The outcome also depends on source data, routing rules, human review, queue capacity, and whether the destination record was actually updated.
Which metrics belong in an AI automation scorecard?
A useful scorecard covers six questions: Did the workflow finish the right work, use less time, preserve or improve quality, avoid shifting work to reviewers, operate dependably, and justify its full cost? The UK Government Digital Service's current AI Impact Evaluation Framework similarly separates productivity, efficiency, adoption and real-world performance, staff effects, trust, user impact, and scalability.
| Scorecard layer | Measure | What it prevents |
|---|---|---|
| Business outcome | Correct completions, service target, conversion, renewal, or another owned result | Calling activity a result |
| Speed and capacity | Median end-to-end cycle time, active handling time, throughput per role | Hiding queue time or outliers behind an average |
| Quality | First-pass acceptance, correction rate, rework, missed cases, appeals | Trading speed for defects |
| Human burden | Review minutes per item, exception rate, escalation age, manual recovery | Moving work into a new queue |
| Reliability and risk | Confirmed completion, duplicates, silent misses, recovery time, control breaches | Equating a successful run with a correct finish |
| Economics | Total operating cost per correct completion and net capacity value | Ignoring review, monitoring, vendor use, support, and maintenance |
Choose one primary outcome and a small set of explanatory measures. More metrics can make the report look thorough while weakening the decision. Each measure needs a reason for being there and a named person who can act when it moves.
How do you build a baseline that can survive scrutiny?
Record the metric definition before comparing periods. The definition should name the workflow boundary, source event, completion event, denominator, exclusions, sample, collection method, baseline window, target, guardrail, and owner. Use the same definition after launch unless a documented change makes comparison impossible.
The GDS framework recommends measuring real behavior and outcomes, using a comparison group where possible, and preferring objective evidence over self-reported time savings. For a SaaS workflow, that can mean a staggered rollout, a matched queue, or comparable weeks normalized for volume and case mix. Short studies can still guide a pilot decision, but they should be labeled as early evidence.
- Use medians for skewed cycle-time data and show the sample size.
- Separate active handling time from elapsed queue time.
- Compare rates with the same denominator, not raw error counts at different volumes.
- Record seasonality, policy changes, staffing shifts, and upstream incidents.
- Keep the raw timestamps and review records behind the summary.
If no pre-launch baseline exists, reconstruct one from system logs and a documented sample of completed work. Mark the confidence as low, and use the next stable period to create a better comparison. A reconstructed baseline is useful, but it should not be presented as direct observation.
Which counter-metrics expose a false win?
Pair each claimed gain with a counter-metric that would reveal the cost of achieving it. This makes the scorecard harder to game and catches work that moved rather than disappeared. The counter-metric should use the same workflow boundary and observation period as the gain.
| Claimed gain | Counter-metric | Failure it exposes |
|---|---|---|
| Shorter cycle time | Rework, missed items, appeals, and downstream delay | Fast but wrong work |
| More throughput | First-pass quality and cost per correct completion | Volume inflated by defects |
| Hours reclaimed | Review, exception, recovery, and monitoring time | Manual effort moved elsewhere |
| Higher adoption | Confirmed outcomes and user drop-off | Use without value |
| Positive ROI | Full lifecycle cost and double-count check | Benefits counted twice or costs omitted |
Guardrails are counter-metrics with a hard boundary. Examples include zero cross-account data exposure, no unapproved external send, a maximum exception age, or a minimum first-pass quality rate. If a guardrail fails, a positive average does not rescue the result. The team follows the agreed pause, recovery, and review path.
What does a worked success calculation look like?
Consider a fictional support-triage workflow measured across two comparable four-week periods. Both periods contain 400 eligible tickets. The figures below demonstrate the calculation only. They are not a Zyphh result or a general benchmark.
| Measure | Baseline | Observed after launch | Interpretation |
|---|---|---|---|
| Median end-to-end cycle time | 22 minutes | 14 minutes | Eight minutes faster for the median ticket |
| Items needing rework | 48 of 400 | 28 of 400 | Rework rate changed from 12% to 7% |
| Active human time | 7 minutes per ticket | 2 minutes of review per ticket | Five minutes of capacity released per ticket |
| System and monitoring cost | Not applicable | $650 for the period | New operating cost |
Gross released capacity is (7 minutes minus 2 minutes) multiplied by 400, or 33.3 hours. At an illustrative Finance-approved loaded cost of $55 per hour, the capacity value is about $1,833. Subtracting the $650 operating cost leaves a provisional net capacity value of about $1,183 for the period.
That number is not automatically cash savings. It becomes a financial benefit only if the team reduces spend, avoids an approved cost, increases valuable output, or reallocates the released time to named work. The 2026 Digital and Data Benefits Framework also warns against double counting and recommends a baseline cost, explicit assumptions, and sensitivity analysis.
How should a buyer hold the vendor accountable?
Require an evidence pack that another operator can reproduce without relying on the vendor's dashboard. The U.S. Government Accountability Office's AI Accountability Framework calls for performance metrics that are precise, consistent, and reproducible, plus documented assessment methods and outcomes.
Contract language should say who owns the raw evidence, how long it remains available, and how a metric change is approved. Run count, uptime, response time, and model accuracy belong in the pack, but none can replace the business outcome. A vendor should also expose cases the automation missed, not only work it processed.
When should you scale, tune, pause, or stop?
Scale when the primary outcome improves across enough representative work, every guardrail passes, cost per correct completion is acceptable, and review or exception work stays manageable. The team also needs an owner, monitoring, recovery, and capacity to handle the larger volume.
- Tune when the evidence is trustworthy and an addressable cause explains the gap, such as one data source, rule, prompt, queue, or user group.
- Pause when harm, control failures, silent misses, rising review backlog, or missing audit evidence makes continued operation unsafe or impossible to judge.
- Stop or replace when the business need has ended, a simpler option performs better, or the full operating burden exceeds the value.
NIST's AI RMF Measure guidance recommends comparing production indicators with pre-deployment measures, checking output quality against new ground truth, monitoring anomalies, and assigning responsibility for continued review. Measurement is therefore an operating loop, not a launch report.
What should the next measurement review produce?
Create a one-page scorecard for one live workflow. Name the outcome, baseline, current result, guardrails, evidence source, sample, owner, cost, limitations, and next decision. Keep assumptions beside the calculation.
If the project is still awaiting approval, use the ROI-before-build decision gate to define the baseline and stop rule before delivery starts. If it is already live, schedule the first review when the workflow has enough representative volume, then decide what changes before the next review. The meeting should end with an owner and an action, not another dashboard.
Turn this into your own build plan.
Run the Workflow Opportunity Score or book a strategy call. Bring one repeated workflow, the tools involved, and the number that should move.
Run the scoreSources and further reading
FAQ
What is the best metric for AI automation success?
Use one owned business outcome as the primary metric, then track cycle time, first-pass quality, human review, exceptions, reliability, and total cost to explain it. The best outcome depends on the workflow and must have a stable definition and source.
How long after launch should an AI automation be evaluated?
Wait for enough representative volume to compare the same workflow fairly, but monitor failures and guardrails from the first live run. Early findings may support a tune or pause decision. Sustained business impact often needs a longer window than technical performance.
Can a team measure automation success without a pre-launch baseline?
A team can reconstruct a provisional baseline from logs, timestamps, finance records, and a documented work sample. Label the result and its confidence clearly, then collect a direct baseline or comparison period before making a large scale decision.
Does employee time saved count as automation ROI?
Treat time saved as released capacity until the team shows what happened to it. Count cash savings only when payroll, contractor, overtime, or approved hiring spend falls. Count productivity value when released time moves to named work and produces an observed result.